Measured results. Real-world impact.
The results confirm that Optimal Blue delivers substantial, measurable value – contributing to clients’ ability to scale efficiently, improve execution, manage risk and achieve strong returns across the ecosystem.
-Jordan Brown, MarketWise Advisors, LLC

ABOUT THE STUDY
More than a quarter of Optimal Blue’s nearly 1,000 unique lender customers participated in the analysis, representing a balanced mix of banks, credit unions, independent mortgage banks, and housing authorities. Because Optimal Blue’s client base spans various segments of the mortgage market, the participating institutions collectively provide a representative cross‑section of lender types, sizes, and business models.
Having performed more than 200 similar studies, MarketWise applies a deliberately conservative methodology to assess value delivery, using median production volumes and client-reported outcomes to quantify financial and operational impact while avoiding assumptions that could overstate results.
FIVE KEY FINDINGS
01Proven impact: Average positive impact of more than $1,000 per loan.
Across the Optimal Blue ecosystem, lenders reported an average net benefit of $1,006 per closed loan.¹
The study found that mortgage lenders using Optimal Blue technology report an average net benefit of $1,006 per loan, reflecting measurable gains in execution quality, risk reduction, automation, and operational efficiency. These results highlight the value created when multiple platform capabilities are used together within a single, integrated platform.
Average net benefit per loan
Client‑reported financial and operational impact from using the platform.

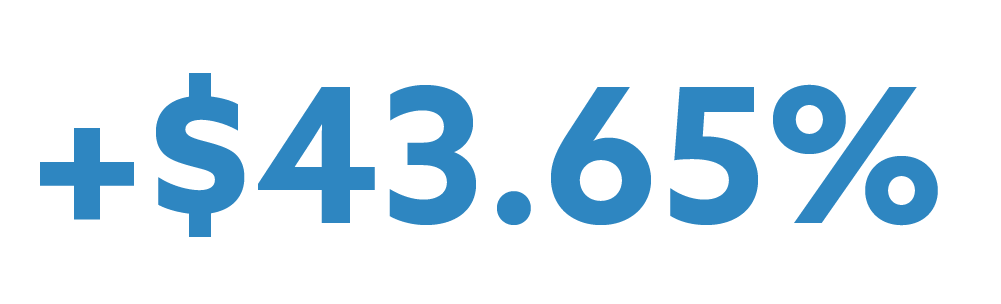
02Proven scale: Nearly 45% increase in operational capacity
Respondents reported a 43.65% improvement in their ability to manage higher loan volume using Optimal Blue technology without requiring an increase in staff.²
By combining pricing, execution, data, and secondary marketing tools within a single platform, lenders can scale loan production more efficiently and respond more effectively to changing market conditions. In practical terms, this represents higher throughput capacity without proportional staffing growth. This level of flexibility supports both growth and operational stability as volume and market conditions fluctuate.
Increase in operational capacity
Higher loan volume supported without increasing headcount.
03Proven execution: More than $400 per‑loan impact from advanced hedging and secondary marketing tools
AI‑driven hedging and trading capabilities supporting strategic execution, trade optimization, MSR valuation and mark‑to‑market reporting produced an average financial impact of $401.43 per loan.³
These results reflect the value delivered by advanced hedging and secondary marketing tools that support confident execution and informed decision‑making across the capital markets lifecycle. These help lenders manage risk and optimize loan sale decisions across varying market environments.
Average impact per loan
Reported gains from AI‑driven execution and secondary marketing tools.

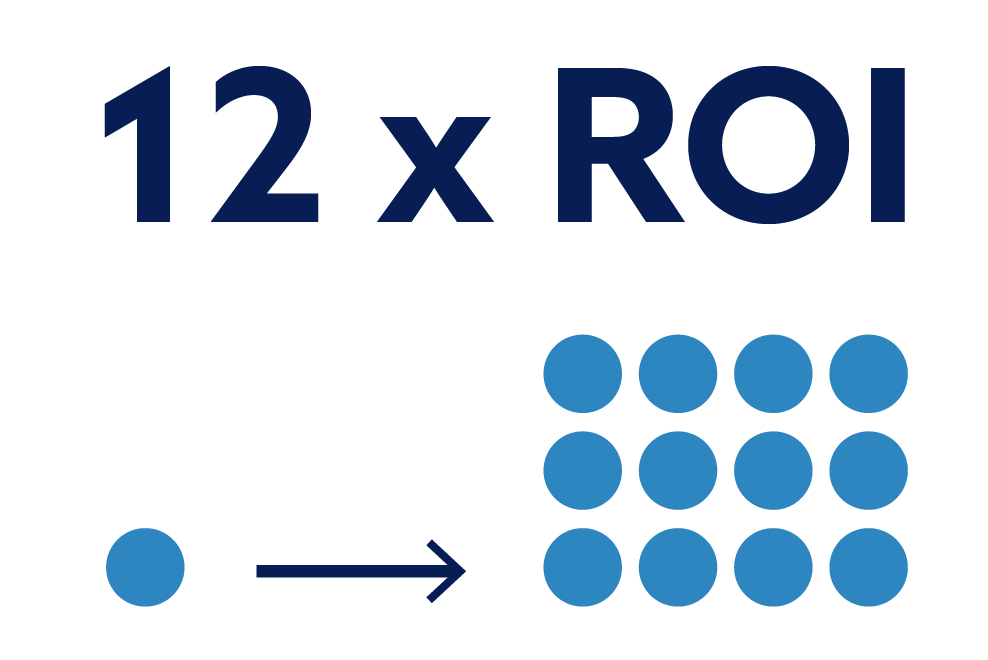
04Proven value: 12X ROI for Optimal Blue PPE clients
Clients reported a median return on investment of 1,193%, representing nearly $12 returned for every dollar spent with Optimal Blue.⁴
The analysis highlights the value delivered by Optimal Blue’s Product and Pricing Engine (PPE), with clients reporting strong returns driven by pricing accuracy, eligibility confidence, and execution efficiency. As a foundational pricing and locking solution, Optimal Blue’s PPE supports consistent, day‑to‑day financial outcomes.
ROI for PPE clients
Conservative, median‑based returns reported by study participants.
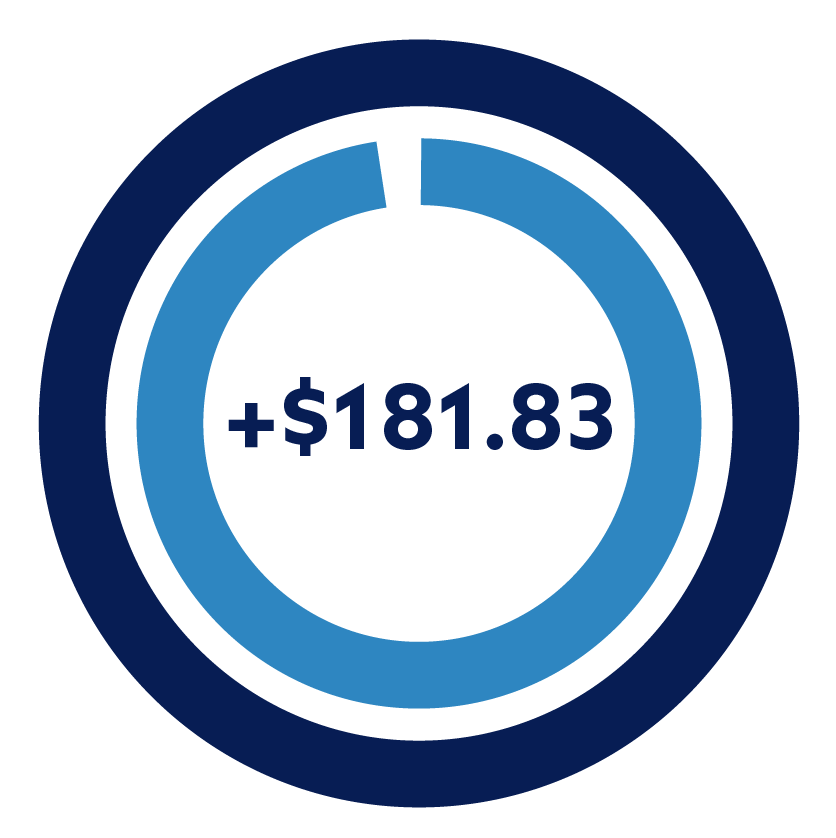
05Proven data quality: Universal error reduction with measurable financial impact
100% of survey respondents indicated that Optimal Blue helps reduce errors, with 98% reporting financial benefits tied to improved pricing and eligibility accuracy. These benefits represent an average additional gain of $181.83 per loan.⁵
Across the institutions studied, lenders reported major improvements in accuracy, translating directly into measurable financial benefit while reducing downstream risk. These accuracy improvements help reduce friction in pricing and eligibility decisions while supporting stronger execution outcomes.
Average impact per loan
Financial benefit tied to improved accuracy and reduced downstream risk.
Optimal Blue supports profitability across both sides of the P&L
“In mortgage capital markets, every basis point matters. That is why our core goal is providing our clients with data that enables them to be more competitive. When lenders are gaining more than $1,000 per loan and achieving a rate of return of $12 for every $1 spent, that’s more than efficiency, that is operational advantage. This independent analysis confirms what our clients experience every day: when lenders have better technology, including use-case specific AI tools backed by real expertise, the impact shows up on their bottom line.”
-Joe Tyrrell, CEO of Optimal Blue

Platform capabilities driving measurable impact
As part of the study, participants cited the following Optimal Blue products and capabilities as meaningful contributors to financial and operational outcomes.
Product and Pricing for Mortgage Lenders
Enterprise PPE for pricing, locking, and margin management
Hedging and Trading
Mitigate pipeline risk and simplify loan sales
Market Data and Business Intelligence
Real-time insights on mortgage pricing and demand
Compliance and Counterparty Oversight
Automate oversight to protect and monitor lenders with Comergence
Frequently Asked Questions
Ready to see what similar results could look like for your team?
The complete Optimal Blue Operational and Financial Impact study is available now.
Access the complete findings, methodology, and deeper product-level insights.
¹ This is the average impact reported for Optimal Blue’s ecosystem, which includes PPE, hedging and trading solutions, Comergence, and data solutions. Neither MarketWise Advisors, LLC, nor Optimal Blue provides any warranty or representation on performance. Individual performance will vary.
² This is the average reported operational leverage (mean value) for Optimal Blue PPE, hedging and trading, and data solutions.
³ Optimal Blue Survey, first quarter 2026. Includes best execution, pool solver, trade assistant, bulk bidding platform, bulk AOT workflow, MSR valuation, and market‑to‑market reporting.
⁴ This is the median ROI (return on investment) reported for PPE, based on a median client closing 1,250 loans annually.
⁵ Optimal Blue Survey, fourth quarter 2025. Results include 80% yes, 18% maybe, and 2% no. Total positive responses reflect the combined yes and maybe responses, resulting in a mean value of $181.83 per loan.